What the numbers show
Was Tesla’s Q2 2026 rebound broad-based, or concentrated in certain models and regions?
The worldwide result improved substantially, but the recovery was uneven. The comparisons below build on the earlier assignment and separate product concentration from regional performance.
1. Model 3/Y drove nearly all of the increase
Worldwide deliveries rose from 384,122 in Q2 2025 to 480,126 in Q2 2026, a 25.0% increase. Model 3/Y represented 467,762 of the latest quarter’s deliveries, or 97.4%.
| Model group | Q2 2025 deliveries | Q2 2026 deliveries | Increase |
|---|---|---|---|
| Model 3/Y | 373,728 | 467,762 | 94,034 |
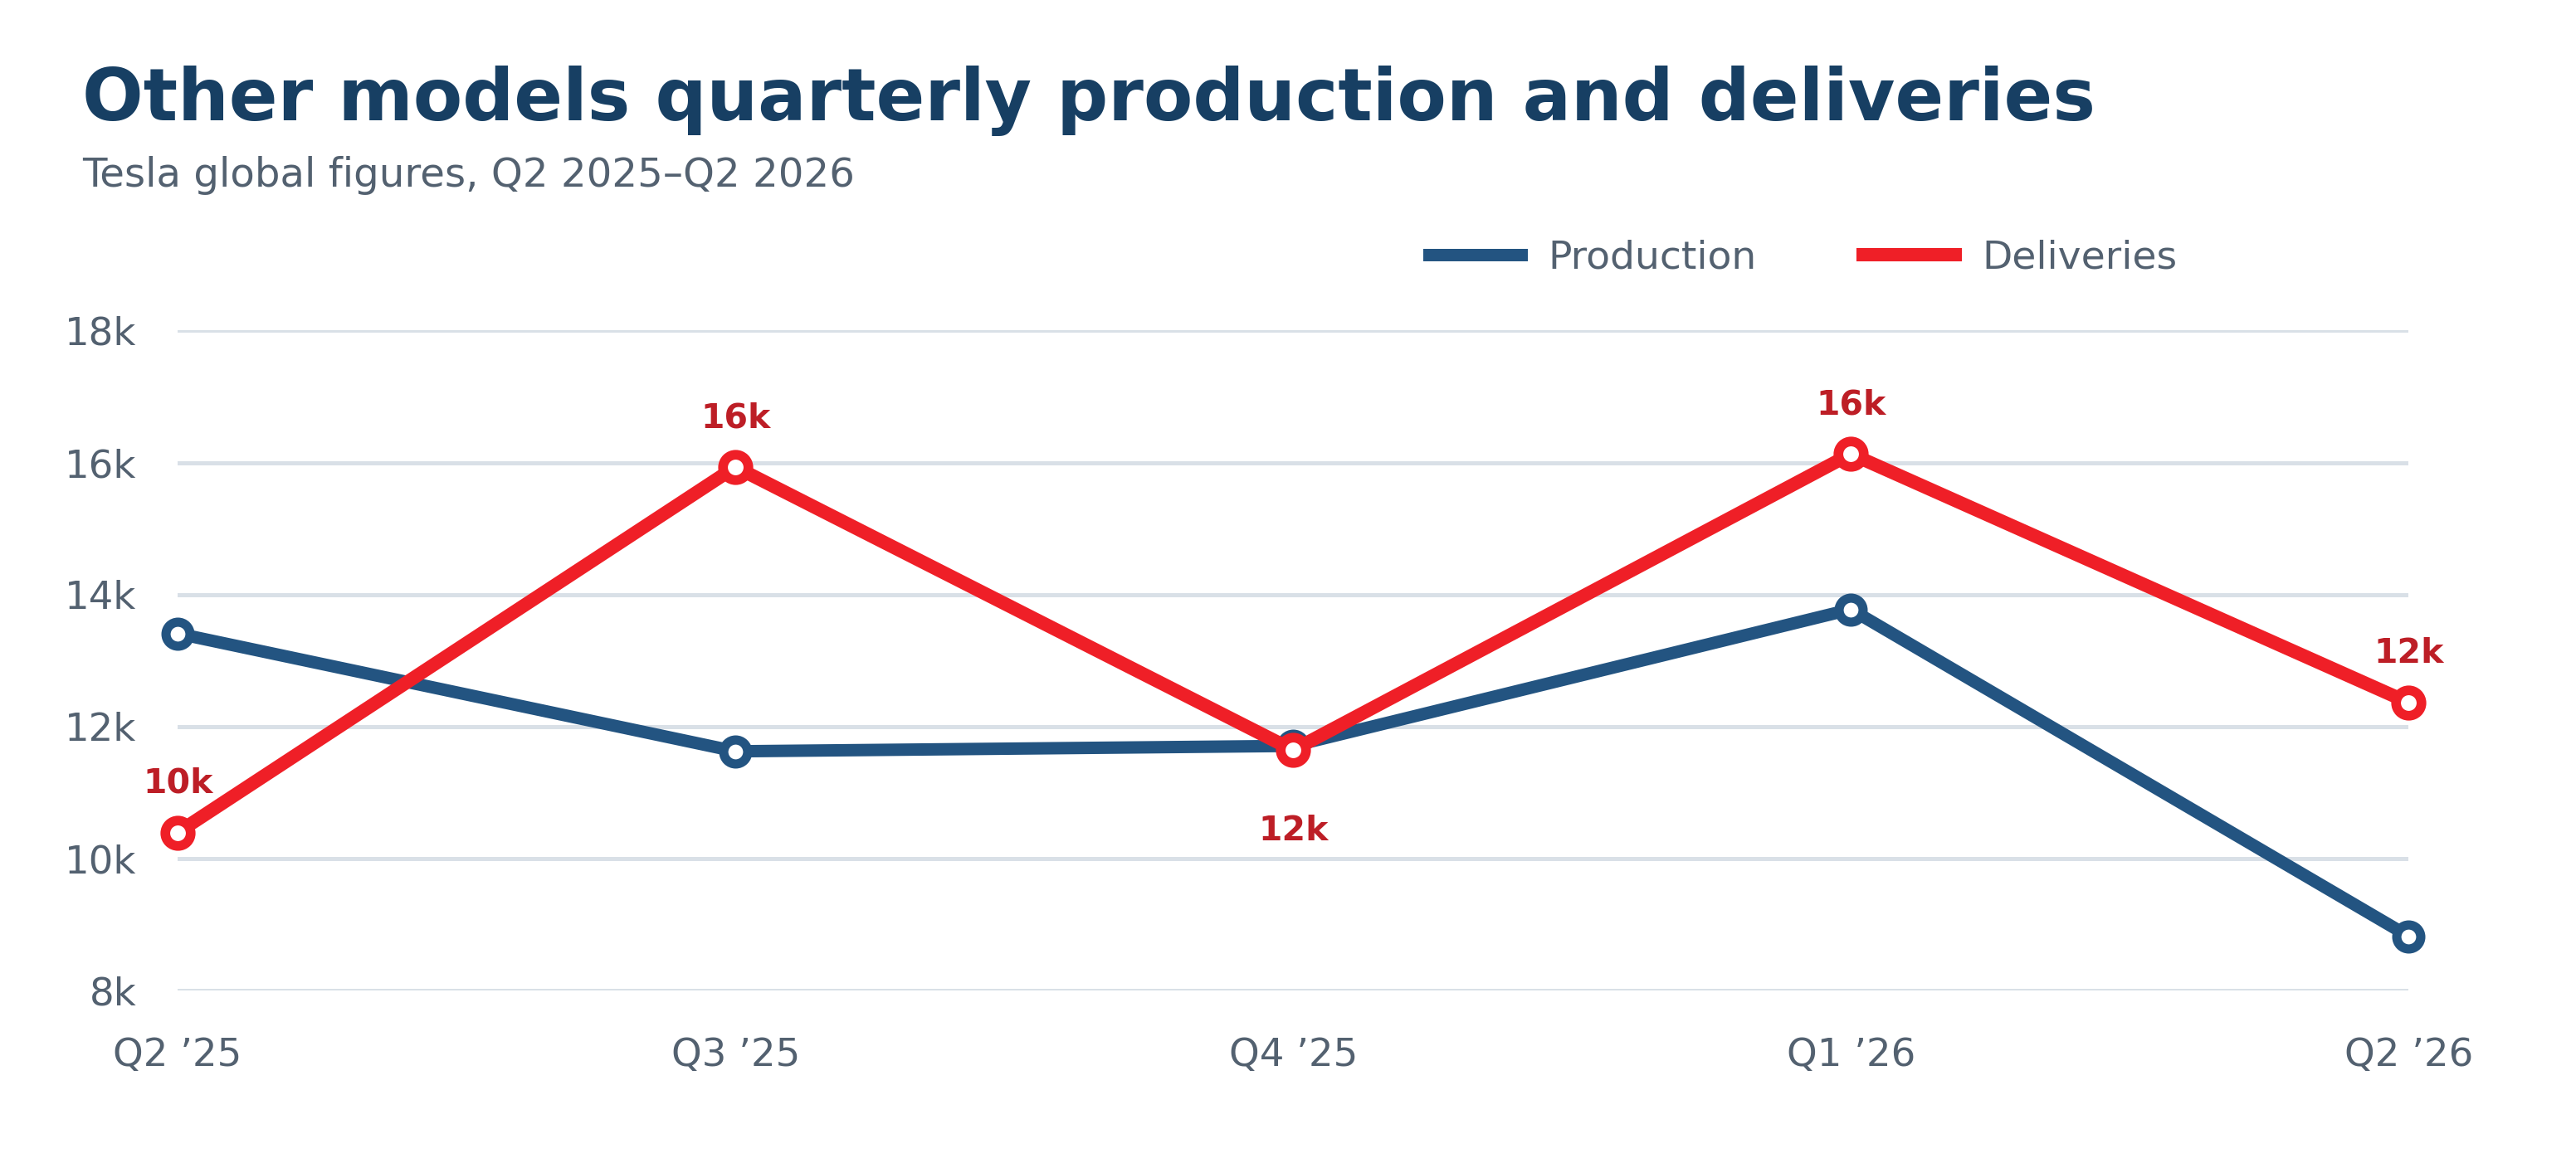
| Other models | 10,394 | 12,364 | 1,970 |
| Total | 384,122 | 480,126 | 96,004 |
Source: Tesla Q2 2026 Update, PDF p. 7 · Saved PDF. Full worldwide dataset.
Model 3/Y contributed 94,034 of the 96,004 additional deliveries: 97.9% of the year-over-year increase. The other models grew 19.0% year over year, but fell 23.3% from Q1 2026. Growth therefore remained heavily concentrated in Model 3/Y.
2. U.S. sales declined, while Tesla’s EV share increased
Cox/KBB estimated 124,800 U.S. Tesla sales in Q2 2026, down from 143,535 a year earlier. Model Y was almost flat at −1.5%, while Model 3 fell 28.4%. Model 3’s decline of 13,859 vehicles accounted for about 74.0% of Tesla’s net U.S. decline of 18,735.
Model Y and Model 3 together supplied 119,807 of Tesla’s estimated U.S. sales, or 96.0%. The dependence on these two models also appeared in the U.S. estimates.
Tesla’s sales fell 13.1%, but the entire U.S. EV market fell 20.5%. Tesla’s estimated segment share rose from about 46.1% to 50.5%, calculated as 143,535 ÷ 311,064 and 124,800 ÷ 247,226. A brand can gain share while selling fewer vehicles if the overall market falls faster.
Source: Cox/KBB report, pp. 2 and 4 · Saved PDF. Check the model-level estimates.
3. Europe grew, but the comparison has limits
Tesla’s January–June registrations across the EU + EFTA + UK rose 54.6% to 170,351. That exceeded the region’s 35.1% growth in battery-electric registrations. Tesla’s share of all new-car registrations increased from 1.6% to 2.4%.
BYD recorded 174,144 first-half registrations, 3,793 more than Tesla, and grew 145.5%. This shows competitive pressure, but it is a manufacturer comparison: BYD’s count includes vehicles with different powertrains, so it is not a direct comparison of battery-electric sales alone.
The European figures cover six months, while the worldwide headline covers three months. They show that European registrations were recovering, but they do not establish Europe’s exact contribution to Tesla’s Q2 delivery growth. Tesla’s worldwide table does not provide that regional breakdown.
Source: ACEA June 2026 report · Saved PDF. Compare the geographies and periods.
4. Deliveries exceeded production
Q2 deliveries of 480,126 exceeded production of 451,758 by 28,368 vehicles. Reported inventory days fell from 27 in Q1 to 15 in Q2.
These measures are consistent with lower inventory pressure, but the production–delivery gap is not a complete inventory accounting statement. Delivery counts alone also cannot establish revenue, profit, or the effect of pricing.
Source: Tesla Q2 2026 Update · Saved PDF. Review production and delivery counts.
Conclusion
Tesla’s worldwide rebound was substantial, but it did not extend evenly across the lineup or the regions examined. Model 3/Y drove nearly all the delivery increase, U.S. sales estimates declined, and Europe recorded strong first-half registration growth.
The next comparison should preserve the same geography and time period across sources wherever possible. A regional delivery breakdown and additional model-level detail would help determine what drove the global result.