Tesla’s rebound was uneven
Worldwide deliveries increased in Q2 2026, but estimated U.S. sales fell. Looking at the regions and models separately gives a clearer picture.
What this report covers
Tesla’s total delivery count is useful, but it cannot show whether every model or region is doing well. This report compares Tesla’s global figures with U.S. sales estimates from Cox Automotive/Kelley Blue Book and European registrations from ACEA.
The main question is: Was the rebound broad-based, or concentrated in certain products and regions?
The evidence points to strong global growth with continued dependence on Model 3 and Model Y. Europe also recorded growth, while the U.S. estimates moved in the opposite direction.
Why look beyond the global total?
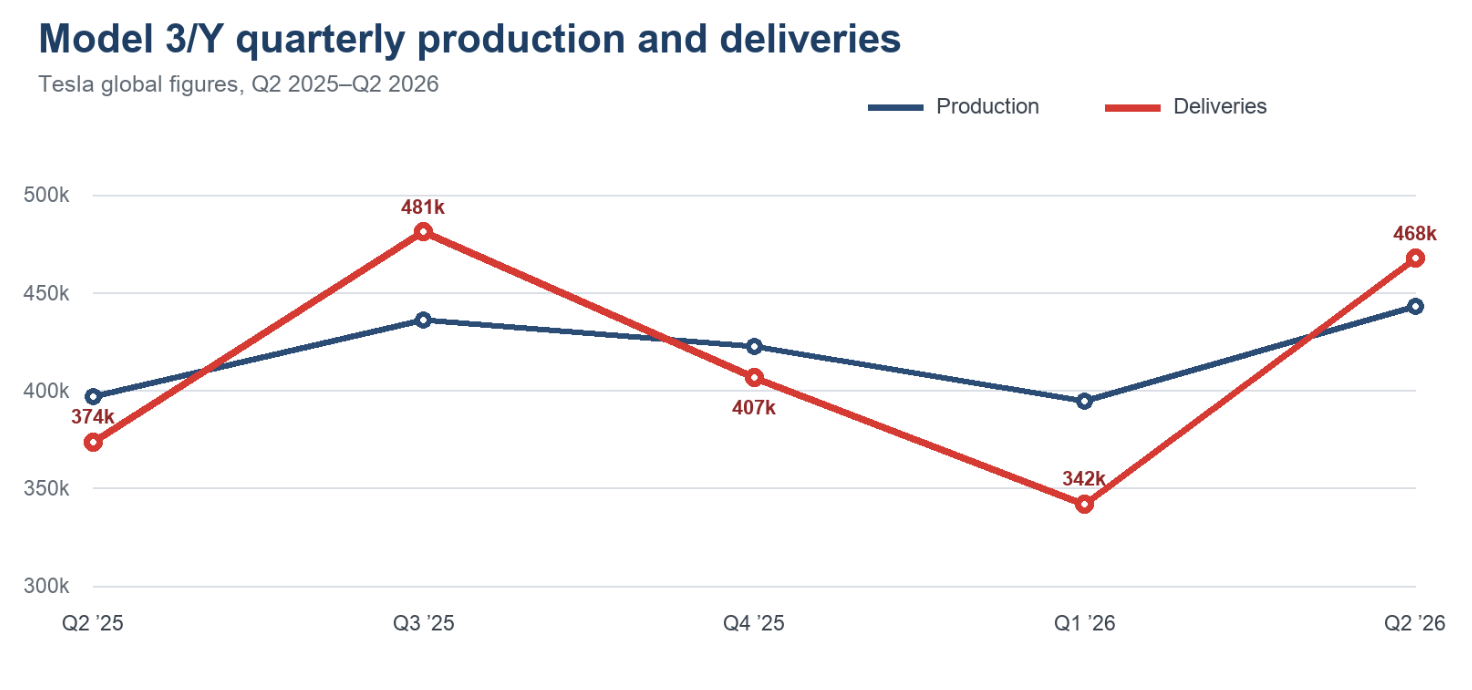
Model 3/Y supplied 97.4% of Q2 2026 deliveries. That concentration matters when interpreting a rebound: a strong result for two models can dominate the company-wide number.
Regional comparisons also matter. Worldwide growth and a U.S. decline can happen at the same time. European registrations add context, but their first-half reporting period does not identify how much Europe contributed to the second-quarter delivery increase.
Start with the worldwide table, compare the U.S. models, then review the European registrations.